Alan D. Thompson
April 2026
Context
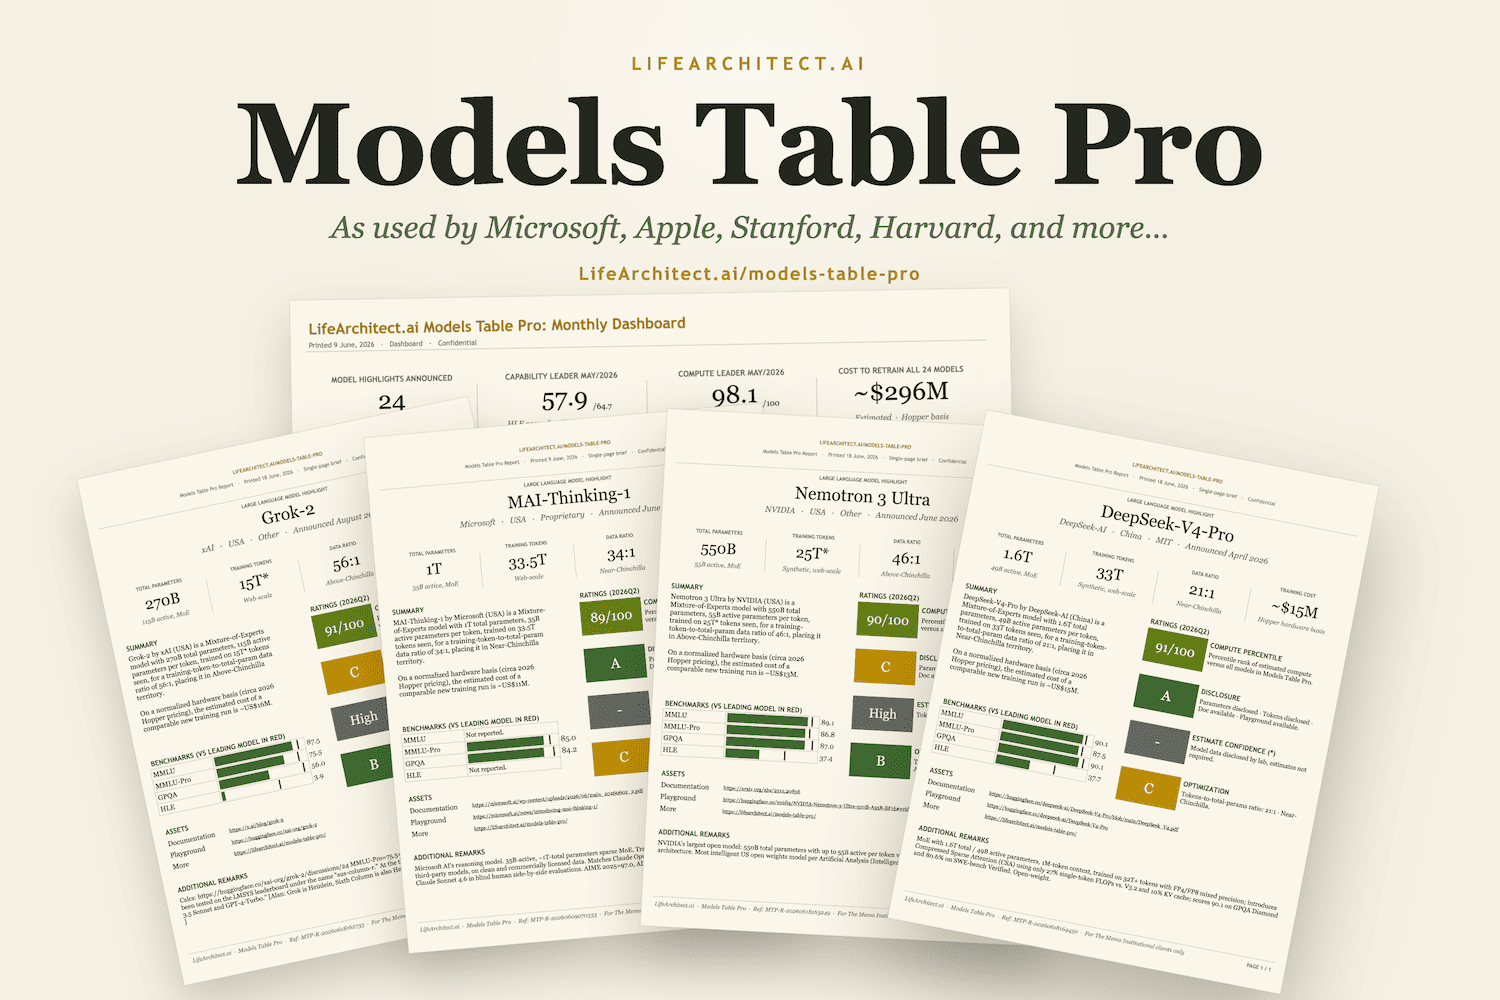
The Models Table Pro (and public-facing Models Table) show the running output of years of full-time LLM analysis, currently 30,000+ data points across 800+ models, documented by hand and updated the day each model launches. This data is used as an independent reference inside frontier labs, Fortune 500s, and several governments.
Since around 2023, when DeepMind stopped publishing detailed training papers, frontier labs have generally kept architecture and training details confidential. Independent estimation fills that gap, and it’s what the parameter and token columns represent. The rest of this page shows the method, and a few cases where carried estimates were later confirmed by direct lab disclosure.
Estimates and accuracy
Any parameter or token figure in italics is my estimate; anything in regular weight is disclosed by the lab, quoted from a paper, or otherwise on the public record. Since we can’t derive ground truth in the current climate of trade secrets, every italic figure is a best-informed centrepoint: when I show ‘2T’, the real range is roughly 1T to 3T, widening to 4T at the factor-of-two band Epoch AI uses. Models Table Pro adds my confidence grade on every estimate, and selected per-model working is documented in The Memo special editions and methodology papers What’s in My AI?, What’s in GPT-5?, and What’s in Grok?
A useful external check: Ege Erdil at Epoch AI arrived at the same ~200B figure for o1 that I had, and framed the uncertainty this way:
This would put its total parameter count around 200 billion, though this estimate could easily be off by a factor of 2 [100B to 400B] given the rough way I’ve arrived at it. (Epoch AI)
Total Parameters
Models Table Pro now shows both total and active parameters. For Mixture-of-Experts (MoE) models the two can differ by an order of magnitude, so both matter: total params track the model’s full capacity, while active-per-token params track what actually fires on each forward pass (and what inference cost scales with).
Tokens seen
Token figures use the same italics convention. Each estimate starts from the parameter figure and a tokens-per-parameter ratio as a first-pass sanity check, then gets refined against lab statements on training compute, duration, hardware allocation, and dataset composition. The token-counting methodology for publicly-known corpora is documented in What’s in My AI?, and the Chinchilla page (https://lifearchitect.ai/chinchilla/) tracks how the ratio itself has evolved from 1.7:1 (Kaplan, 2020) through 20:1 (Chinchilla, 2022) to 80,000:1 (LFM2.5-350M, 2026).
Lenses for estimates
My estimates come from several lenses, cross-checked against each other and against open-source releases.
Lens 1: Pricing signal
Per-token price gives some signal on active-parameter size, since inference cost scales with active params, but margin bands vary widely across labs (some price close to cost, others add substantial profit). I treat pricing as one input among many, rather than a primary driver. I maintain an older public visualisation of frontier model pricing over time: https://lifearchitect.ai/viz/#frontier-prices.
Lens 2: Capability signal
Benchmark jumps between model generations, on saturating-but-still-useful evals like MMLU-Pro, GPQA, HLE, historically track with both a parameter step and a training-compute step. Combined with the pricing lens, this helps me bracket the estimate.
Lens 3: Supply and demand signals
Three constraints together set the plausible size envelope for any frontier model:
| Signal | What it constrains | Examples |
|---|---|---|
| Training supply | Maximum training compute available | TPU/GPU allocations, datacentre capacity disclosures |
| Inference supply | Deployment footprint and serving cost | Bedrock, Vertex, Foundry, Azure, OpenRouter availability |
| Demand | Realistic serving load | User counts, usage disclosures, queue behaviour |
Lens 4: Cross-checks against open-source frontier releases
When labs release detailed numbers (or full weights), we get ground truth, and I check my proprietary estimates against the known open frontier as they land.
Small models circa 2024
| Model | Lab | Total params | Active params | Tokens seen | GPQA | HLE | Released |
|---|---|---|---|---|---|---|---|
| gpt-oss-120b | OpenAI | 116.8B | 5.1B | 30T | 80.1 | 19 | Aug/2025 |
| gpt-oss-20b | OpenAI | 20.9B | 3.6B | 13T | 71.5 | 17.3 | Aug/2025 |
| GPT-4o | OpenAI | 200B | — | 20T | 53.6 | 3.1 | May/2024 |
Large models circa 2025
| Model | Lab | Total params | Active params | Tokens seen | GPQA | HLE | Released |
|---|---|---|---|---|---|---|---|
| Grok-5 | xAI | 6T | — | — | — | — | — |
| DeepSeek-V4-Pro | DeepSeek | 1.6T | 49B | 33T | 90.1 | 37.7 | Apr/2026 |
| Kimi K2.6 | Moonshot | 1T | 32B | 30.5T | 90.5 | 54 | Apr/2026 |
| Grok-4 | xAI | 3T | — | — | — | — | Jul/2025 |
| Grok-3 | xAI | 3T | — | — | 84.6 | — | Feb/2025 |
Lens 5: Direct insights from labs, plus signals from rumours, news, and disclosures
I have private channels with several labs where I receive context I can’t disclose publicly, which informs the table and in some cases directly shapes specific entries. Separately, I monitor and weight credible rumours, public commentary from researchers and executives, news reporting (Reuters in particular has broken useful detail on frontier training runs and chip allocations), and partial disclosures (Amazon’s Titan family is a good example, where most of what we know publicly came through fragmented announcements and sideways comments rather than published papers). These get cross-checked against the lenses above before I commit a number.
Worked example: Grok-3 and Grok-4
The clearest test of any estimation method is a carried estimate that later meets ground truth. The Grok family is exactly that case: centrepoints I published months ahead, left unchanged, and then matched against direct disclosures from the lab.
In Jul/2025, Models Table Pro centrepoints for the Grok family were:
| Model | My estimate (Jul/2025) | Lens reasoning |
|---|---|---|
| Grok-3 | ~3T total parameters | Capability bracket against GPT-4-class models, Colossus training-supply disclosure (100K+ H100s), public benchmark performance |
| Grok-4 | ~3T total parameters | xAI public statements that Grok-4 was a post-training/RL upgrade rather than a new pretrain, similar inference cost |
On 15/Nov/2025, the xAI CEO disclosed publicly:
[Grok-5] is a 6 trillion parameter model, whereas Grok-3 and -4 are based on a 3 trillion parameter model. (xAI CEO, 15/Nov/2025, covered at https://lifearchitect.ai/grok/)
Comparison of my carried estimate to the disclosed figure:
| Model | My estimate | Disclosed (Nov/2025) | Delta |
|---|---|---|---|
| Grok-3 | 3T (Feb/2025) | 3T (Nov/2025) | Match |
| Grok-4 | 3T (Jul/2025) | 3T (Nov/2025) | Match |
The Grok-3 and Grok-4 centrepoints landed on the disclosed figures. This is the kind of cross-check that validates the lens method, particularly Lens 3 (training supply via Colossus), Lens 1 (pricing/capability bracket), and Lens 4 (open-source frontier comparisons).
Pine AI’s knowledge-probe method
In April 2026, Bojie Li at Pine AI published Incompressible Knowledge Probes (arXiv 2604.24827), a separate parameter-estimation method that uses factual recall to lower-bound how much a model knows, and inverts a calibration on 89 open-weight models (R²=0.917) to estimate proprietary model sizes. It is the first published method to estimate frontier proprietary model sizes by measuring factual recall directly, and a useful cross-reference for the figures in Models Table Pro.
| Model | Vendor | Accuracy | Est. Size | 90% PI |
|---|---|---|---|---|
| GPT-5.5 | OpenAI | 71.9% | ~9.7T | [3.2–28.7T] |
| Claude Opus 4.6 | Anthropic | 68.0% | ~5.3T | [1.8–15.6T] |
| GPT-5 Pro | OpenAI | 66.5% | ~4.1T | [1.4–12.2T] |
| GPT-5 | OpenAI | 66.4% | ~4.1T | [1.4–12.1T] |
| Claude Opus 4.7 | Anthropic | 66.4% | ~4.0T | [1.4–12.0T] |
| o1 | OpenAI | 65.4% | ~3.5T | [1.2–10.3T] |
| Claude Opus 4.5 | Anthropic | 65.2% | ~3.4T | [1.1–10.0T] |
| Claude Opus 4.1 | Anthropic | 64.9% | ~3.2T | [1.1–9.5T] |
| Grok-4 | xAI | 64.8% | ~3.2T | [1.1–9.4T] |
| o3 | OpenAI | 64.4% | ~3.0T | [1.0–8.9T] |
| GPT-5.4 Pro | OpenAI | 62.5% | ~2.2T | [736B–6.5T] |
| GPT-4.1 | OpenAI | 62.3% | ~2.2T | [719B–6.4T] |
| Grok-3 | xAI | 62.3% | ~2.1T | [715B–6.3T] |
| Claude Sonnet 4.6 | Anthropic | 60.9% | ~1.7T | [579B–5.1T] |
| GPT-5.3 | OpenAI | 60.0% | ~1.5T | [503B–4.5T] |
| GPT-5.2 Pro | OpenAI | 59.7% | ~1.4T | [478B–4.2T] |
| Claude Opus 4 | Anthropic | 59.7% | ~1.4T | [478B–4.2T] |
| GPT-5.1 | OpenAI | 59.3% | ~1.3T | [450B–4.0T] |
| GPT-5.2 | OpenAI | 58.9% | ~1.3T | [417B–3.8T] |
| Gemini 2.5 Pro | 58.4% | ~1.2T | [387B–3.4T] | |
| GPT-5.4 | OpenAI | 57.7% | ~1.0T | [348B–3.1T] |
| GPT-4o | OpenAI | 55.3% | ~720B | [241B–2.1T] |
| Qwen3-Max | Alibaba | 55.0% | ~685B | [229B–2.0T] |
| GPT-4 | OpenAI | 54.8% | ~666B | [223B–2.0T] |
| GPT-4-Turbo | OpenAI | 54.5% | ~630B | [211B–1.9T] |
| GPT-5 Mini | OpenAI | 51.7% | ~410B | [137B–1.2T] |
| Gemini 2.5 Flash | 47.4% | ~207B | [69B–617B] | |
| Claude 3.5 Haiku | Anthropic | 45.6% | ~158B | [53B–470B] |
| GPT-5 Nano | OpenAI | 40.5% | ~71B | [24B–212B] |
| Claude Haiku 4.5 | Anthropic | 39.9% | ~65B | [22B–194B] |
Source: Pine AI’s paper (Apr/2026), p13.
Caveats on Pine AI’s specific estimates
Pine’s method is intrinsic (it measures stored facts through black-box probes), so its numbers represent effective knowledge capacity rather than raw parameter count. That framing explains most gaps from working consensus, for example the GPT-4 and o1 figures sitting below the widely-reported SemiAnalysis lineage. I anchor each row against the disclosed and open-weight figures rather than reading it alone.
Where the two methods agree on recent frontier estimates:
| Model | My estimate | Pine (Apr/2026) | Notes |
|---|---|---|---|
| Claude Opus 4.6 | ~5T | ~5.3T | Match |
| GPT-5 | 3T | ~4.1T | Within Pine’s interval, slightly above mine |
| Grok-4 | 3T (disclosed) | ~3.2T | Both close to disclosed |
| Grok-3 | 3T (disclosed) | ~2.1T | Both inside intervals; mine landed exactly on the disclosure |
The two methods are measuring slightly different things, Pine’s estimates represent effective knowledge capacity in open-model-equivalent parameters, which can run higher than raw parameter count for proprietary models with heavy post-training or denser data. So a gap on a single model is not necessarily evidence that one method is wrong; it can also mean the model stores more factual knowledge per parameter than the open-weight calibration set predicts. This convergence is what feeds the confidence grade in Models Table Pro: the more independent signals that agree on a figure, the higher it is graded.
Closing
No method gets every estimate right when labs keep their architecture and training details confidential. Grok-3 and Grok-4 landed on the disclosed figures. The Claude Mythos compute estimate will move once the picture settles. I’ll continue providing informed estimates from the best signals available, documenting the working, and updating when the ground truth arrives.
Models Table Pro is updated continuously. Detailed analyses are available to full subscribers in The Memo.
Further reading
| Resource | Type | What it covers |
|---|---|---|
| Models Table Pro | Reference table | The reference table for 30,000+ LLM data points, including full compute, pricing, and more. |
| Models Table | Public table | The public table for 10,000+ LLM data points, including parameter and token estimates. |
| What’s in My AI? | Free public paper | Token-counting methodology for publicly-known training corpora |
| What’s in GPT-5? | Methodology paper | Full parameter/token derivation for GPT-5, including synthetic-data analysis (cited by the G7) |
| What’s in Grok? | Methodology paper | Full parameter/token derivation for the Grok family |
| Frontier pricing visualisation | Viz | Older version of the price-lens method |
| The Memo – GPT-5 special edition | Paid per-model analysis | Per-model sizing working for GPT-5 |
| The Memo – Claude Mythos special edition | Paid per-model analysis | Per-model sizing working for Claude Mythos Preview |
| Datasets Table | Reference table | Largest known training datasets, updated continuously |
| Chinchilla data scaling laws page | Reference page | Tokens-to-parameters ratio research from Chinchilla onward |
Get The Memo
by Dr Alan D. Thompson · Be inside the lightning-fast AI revolution.Informs research at Apple, Google, Microsoft · Bestseller in 152 countries.
Artificial intelligence that matters, as it happens, in plain English.
Get The Memo.
 Alan D. Thompson is a world expert in artificial intelligence, advising everyone from Apple to the US Government on integrated AI. Throughout Mensa International’s history, both Isaac Asimov and Alan held leadership roles, each exploring the frontier between human and artificial minds. His landmark analysis of post-2020 AI—from his widely-cited Models Table to his regular intelligence briefing The Memo—has shaped how governments and Fortune 500s approach artificial intelligence. With popular tools like the Declaration on AI Consciousness, and the ASI checklist, Alan continues to illuminate humanity’s AI evolution. Technical highlights.
This page last updated: 18/Jun/2026. https://lifearchitect.ai/models-table-methodology/↑